Investment Thesis
The iShares Russell 1000 ETF (NYSEARCA:IWB) warrants a buy rating due to its current mix of holdings, including its comparatively lower weight on several overvalued companies. While IWB has seen strong performance in comparison to other Russell 1000 peer funds, Vanguards Russell 1000 Growth Index Fund ETF (VONG) will likely outperform due to its greater concentration on top performers. IWB also has a competitive expense ratio in comparison to other peer funds as well as a noteworthy dividend yield.
Fund Overview and Compared ETFs
IWB is an ETF that seeks to track the results of an index composed of large and mid-cap U.S. equities. With its inception in 2000, the fund has 1,008 holdings and $33.55B in AUM. IWB has the greatest sector weight on information technology (28.52%), followed by financials (13.45%) and health care (12.58%). IWB is based on the Russell 1000 index which represents the 1,000 top U.S. companies by market capitalization.
For comparison purposes, other Russell 1000 ETFs examined are Invesco Russell 1000 Equal Weight ETF (EQAL), VONG, and Invesco Russell 1000 Dynamic Multifactor ETF (OMFL). EQAL is distinctly different from IWB in that it tracks the Russell 1000 Equal Weight Index. Therefore, while its quantity of holdings is similar to IWB, EQAL’s weight on each top holding is significantly different. VONG tracks the Russell 1000 Growth Index and therefore has an emphasis in holdings and weight on large-cap growth U.S. stocks. OMFL is based on the Russell 1000 Invesco Dynamic Multifactor Index. This fund is rebalanced quarterly based on a multi-factor scoring system including value, momentum, and quality.
Performance, Expense Ratio, and Dividend Yield
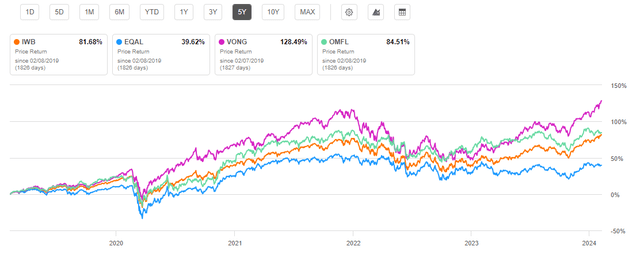
A 5-year time period was utilized for comparing the performance of each fund since not all ETFs compared were initiated more than five years ago. IWB has a 5-year compound annual growth rate, or CAGR, of 15.37%. By comparison, EQAL has a 5-year CAGR of 11.60%, VONG has a 5-year CAGR of 17.95%, and OMFL has a 5-year CAGR of 17.53%.

5-Year Total Price Return: IWB and Top Competitor Funds (Seeking Alpha)
Compared to all ETFs, IWB has an attractive expense ratio at just 0.15%. This is only higher than VONG which has a very low expense ratio of 0.08%. IWB also has a commendable dividend yield at 1.26%. This dividend yield has also been growing over the past years with a 5-year CAGR of 3.76%.
Expense Ratio, AUM, and Dividend Yield Comparison
IWB | EQAL | VONG | OMFL | |
Expense Ratio | 0.15% | 0.20% | 0.08% | 0.29% |
AUM | $33.55B | $574.62M | $23.79B | $5.72B |
Dividend Yield TTM | 1.26% | N/A | 0.51% | 1.41% |
Dividend Growth 5 YR CAGR | 3.76% | N/A | 1.30% | 15.07% |
Source: Seeking Alpha, 8 Feb 24
IWB Holdings and Its Competitive Advantage
Because each of the Russell 1000 ETFs examined have different objectives and tracked indexes, their holdings and weights are significantly different. IWB has the most holdings compared at over 1,000. IWB’s weight on its top holdings is roughly 30%. This is significantly more concentrated than EQAL but less concentrated than VONG with over 50% weight on its top 10 holdings.
Top 10 Holdings for IWB and Compared Funds
IWB – 1,008 holdings | EQAL – 996 holdings | VONG – 443 holdings | OMFL – 377 holdings |
MSFT – 6.71% | LITE – 0.60% | AAPL – 11.95% | BLDR – 1.07% |
AAPL – 6.01% | JNPR – 0.59% | MSFT – 11.78% | HPE – 0.93% |
NVDA – 3.45% | ANET – 0.59% | AMZN – 5.76% | WDC – 0.87% |
AMZN – 3.40% | CIEN – 0.54% | NVDA – 4.95% | JBL – 0.79% |
META – 2.30% | VZ – 0.50% | GOOGL – 3.49% | SYF – 0.78% |
GOOGL – 1.86% | UI – 0.49% | META – 3.29% | STLD – 0.76% |
GOOG – 1.58% | CMSCA – 0.49% | GOOG – 2.98% | PHM – 0.75% |
BRKB – 1.57% | FYBR – 0.48% | TSLA – 2.89% | TSN – 0.73% |
LLY – 1.24% | T – 0.48% | LLY – 2.08% | HPQ – 0.72% |
AVGO – 1.16% | CSCO – 0.48% | AVGO – 2.03% | LDOS – 0.71% |
Source: Multiple, compiled by author on 8 Feb 24
All ETF investors know that a fund’s future performance is tied to the returns of its individual holdings. Key holdings that represent distinct differences for IWB compared to its leading performance competitor, VONG, are Microsoft Corporation (MSFT), Meta Platforms, Inc. (META), Tesla, Inc. (TSLA), and NVIDIA Corporation (NVDA). These differences in holdings are discussed in further detail below.
IWB Disadvantage #1 – Lower Weight on Microsoft
The first disadvantage for IWB is its comparatively lower weight on MSFT than VONG. Although Microsoft is IWB’s heaviest holding at 6.71%, this still lags VONG at an 11.78% weight. While Microsoft’s valuation is high with a forward P/E that is 29% higher than its sector median, Microsoft has proven itself as a bastion of mega-cap growth. Furthermore, the company is continuously innovating and remaining at the forefront of relevancy. One example is its cloud computing platform, Azure, which saw 30% revenue growth last quarter along with other cloud services. Consequently, MSFT commands a 69.8% gross profit margin and 36.27% net income margin. With 21.91% YoY EBITDA growth, there is strong momentum behind this tech behemoth.
IWB Disadvantage #2 – Lower Weight on Meta
The second disadvantage for IWB compared to VONG is its lower weight on META. While IWB has a 2.3% weight on META, VONG has a 3.29% weight. In my opinion, this puts IWB at a disadvantage to growth ETFs that hold META. Meta Platforms has demonstrated very strong fundamentals recently including a 28.98% net income margin, a 28.04% return on common equity, and a 42.48% YoY EBITDA growth. Despite these strong metrics, META’s forward P/E ratio and forward EV/EBITDA are currently less than 5% higher than its own 5-year average. Therefore, META’s valuation is currently attractive and has one of the biggest buys for me among mega-cap, big tech stocks. Because of these strengths, META will likely propel ETFs that have it as a holding.
IWB Advantage #1 – Lower Weight on Tesla
Although IWB has two disadvantages to VONG as discussed above, it has two advantages over the Vanguard peer fund as well. First, IWB has a lower weight (1.12%) on TSLA compared to VONG (2.89%). Tesla has seen a -22.25% YoY EBITDA growth along with -47% YoY levered FCF growth. While the United Auto Workers union has not unionized Tesla workers, UAW’s recent successes have certainly added pressure. Finally, Tesla has a forward P/E GAAP that is 272% higher than its sector average. Therefore, despite a 23.7% decline in share price YTD, it is still arguably overvalued. Due to these factors, IWB is better postured the VONG due to its lower weight on TSLA.
IWB Advantage #2 – Lower Weight on NVIDIA
The second key advantage of IWB over VONG is its lower weight on NVDA. NVIDIA Corporation saw an incredible year in 2023 leading to its high current price. Just a few metrics to substantiate its meteoric rise are a 57% YoY revenue growth, 154% YoY EBITDA growth, and 42.1% net income margin. Investors poured into NVDA sending its share price up over 210% in one year and over 1,700% over the past five years. However, this has resulted in a high valuation for the company. NVDA’s forward P/E ratio currently stands at 56.96, over double its sector median. Additionally, its forward EV/sales ratio is 900% higher than its sector median. Therefore, while I like NVIDIA and ETFs that contain it as a top holding, IWB’s 3.45% weight versus VONG’s 4.95% represents its second key advantage.
Valuation and Risks to Investors
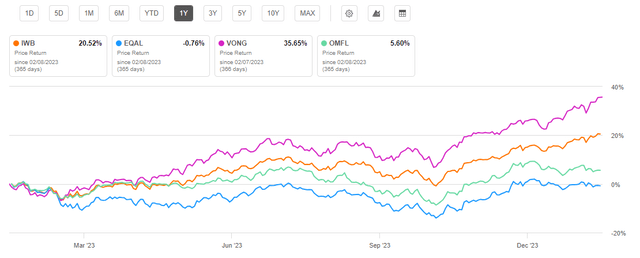
IWB has a current price of $274.29 at the time of writing this article. This price is near the top of its 52-week range of $209.39 to $274.41. IWB’s one year performance has been superior to all compared Russell 1000 funds except for VONG. This lagging performance can predominantly be attributed to the different weight in holdings mentioned above.

One Year Price Return: IWB and Peer Competitors (Seeking Alpha)
VONG is the highest valued compared to all Russell 1000 ETFs examined. This is due to its heavy weight on mega-cap big tech stocks previously discussed. Consequently, IWB is more favorably valued with a 24.10 P/E ratio and 4.28 P/B ratio. While these valuation metrics are less favorable than the P/E and P/B values for EQAL and OMFL, IWB has a stronger holding mix than both these ETFs. Therefore, while I believe IWB is postured to outperform EQAL and OMFL, it may still lag VONG over the long term.
Valuation Metrics for IWB and Peer Competitors
IWB | EQAL | VONG | OMFL | |
P/E ratio | 24.10 | 20.07 | 34.30 | 16.28 |
P/B ratio | 4.28 | 2.19 | 11.4 | 3.00 |
Source: Compiled by Author from Multiple Sources, 8 Feb 24
Despite the broad diversification of the Russell 1000 ETFs discussed in this article, the funds experience volatility that closely matches “the market” overall. Using beta values as a measure of correlation, IWB has a 3-year beta value of 1.01. By comparison, VONG has a beta value of 1.11 compared the Dow Jones U.S. Total Stock Market, implying slightly higher volatility.
Concluding Summary
IWB is an ETF that has a strong track record of performance along with broad diversification with over 1,000 holdings. The fund warrants a buy rating and is only eclipsed in my mind by Vanguard’s competing ETF, VONG. While VONG has significantly outperformed IWB, its current valuation metrics including P/E and P/B are less desirable than IWB. Although IWB has a low expense ratio of 0.15%, VONG’s expense ratio is even lower. IWB has both advantages and disadvantages in comparison to VONG with regard to the weight of its holdings. All things considered, both IWB and VONG represent solid selections for investors seeking the diversification of the Russell 1000 index. However, I expect VONG to perform slightly better than IWB over the long term.