For the decade following the financial crisis, REITs capitalized on a perpetually low interest rate environment to fire up the commercial real estate engine. Declining yields and capitalization rates supported rising REIT valuations and property values. REITs shined during this period. The situation changed dramatically following the pandemic era. Many perceived the Federal Reserve’s low interest rate policy as permanent.
The sea changed in 2023 as many of these tailwinds evaporated over a condensed period. REITs suffered due to rising interest rates and a flight to alternatives such as bonds, treasuries, and, to the surprise of many, tech. Increasing borrowing and capital costs slowed acquisitions and new development across real estate.
Yet again, the tide has begun to change. The Federal Reserve has hinted at near-term rate cuts, which will be critical to short-term REIT performance. The market has taken notice and REITs across the space have rebounded from their October lows. Today, we are going to dive back into one of the best closed-end funds in the real estate space. We’ve covered RQI previously, but feel now is an appropriate opportunity given changes in the market. In the previous coverage, we noted that RQI’s portfolio could benefit from several long-term growth drivers including rising rents and inflation. That said, the coming interest rate risk was substantial.
Fund Overview
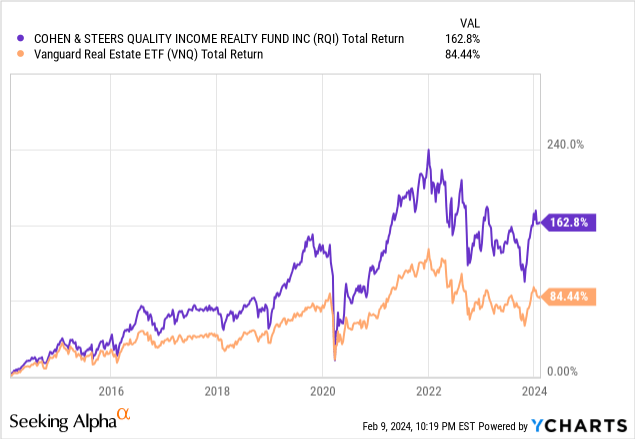
Cohen & Steers Quality Income Realty Fund (NYSE:RQI) is a closed-end fund that invests in high-quality REITs. Cohen & Steers (CNS) specializes in real estate, infrastructure, and preferred stock investments through a selection of vehicles such as managed accounts, CEFs, and traditional mutual funds. While CNS offers many real estate iterations, RQI is a pure play, REIT fund. An alternative to RQI is the Cohen & Steers REIT & Preferred Income Fund (RNP), another real estate CEF that combines REITs and preferreds for a slightly higher internal yield and distribution rate.
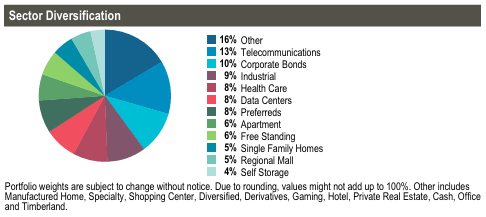
RQI’s portfolio is built from best-in-class companies across the real estate sector. RQI invests in a wide variety of public landlords, each with a concerted area of focus. Sectors are diverse with Telecom (13%), Industrial (9%), and Health Care (8%) leading the largest allocations. Most of the portfolio is dedicated to common stock in equity REITs with a smaller portion invested in the debt of equity REITs.
CNS
RQI’s portfolio is a roll call of best-in-class landlords. The top five positions in the portfolio are American Tower Corporation (AMT), Prologis (PLD), Welltower (WELL), Simon Property Group (SPG), and Invitation Homes (INVH). American Tower is one of the largest global REITs with a portfolio of around 225,000 cell towers and communication sites and additional U.S. data center facilities. PLD is a global leader in logistics real estate owning and operating approximately 1.2 billion square feet (115 million square meters) of industrial real estate in 19 countries. Welltower invests in senior housing properties across the United States, Canada, and the United Kingdom. SPG is one of the world’s largest retail REITs owning a quality portfolio of shopping centers across North America, Europe, and Asia. Finally, INVH owns a massive portfolio of single family homes spread across the United States.

Data by YCharts
Forecasted Rate Cuts
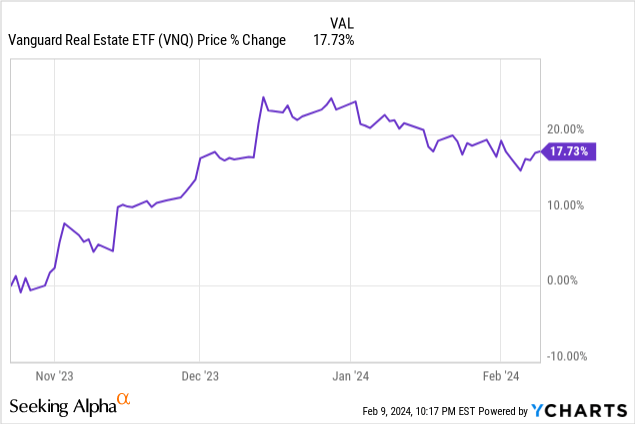
As mentioned in the introduction, the Federal Reserve has begun hinting at interest rate increases. Although a March cut was taken off the table, Powell made all but certain that there would be cuts to rates by year end. This speculation around interest rates has generated spectacular REIT activity over the past four months.
Data by YCharts
The market has begun pricing in these cuts as REIT share prices appreciate, valuations expand, and capitalization rates are projected to decline. The result has been market exuberance.
When all opinions tend to align, we get into trouble. With a consensus appearing to be formed, investors agree that near-term rate cuts are a certainty. The economics are reflected in REIT pricing. For REITs, these cuts might not just be a certainty…they might be a necessity. The cracks in large scale commercial real estate continue to develop. Recently, Janet Yellen voiced “concern” over the state of commercial real estate, observing the massive wave of loans coming for maturity this year. We recently covered the implications of these maturities in our coverage of Ares Commercial Real Estate (ACRE).
Having priced in our precious rate cuts, can we determine if there is value left in RQI.
Valuation
REITs and closed-end funds have various methodologies for valuing and assessing their yield. A simple barometer of an income-producing asset’s relative risk is comparing the yield against the current ten-year treasury. Typically, investors look to the ten-year treasury as a bellwether of relative risk. Described as the “risk free rate”, the ten-year treasury determines the base yield rate for everything from coupon rates to discount rates.
Data by YCharts
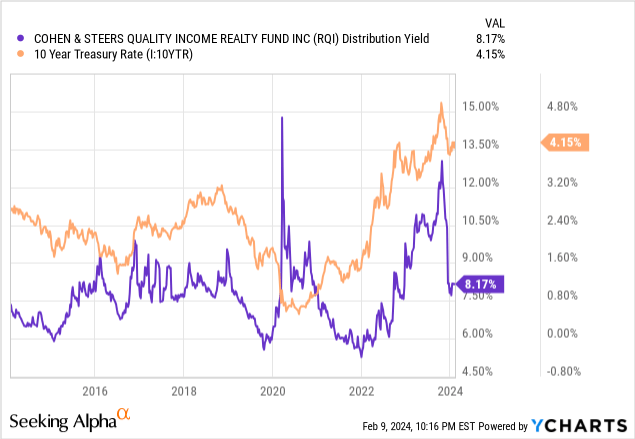
Generally, RQI’s yield tends to follow the ten-year’s movements. When yields systemically rise, RQI’s share price must fall to compensate. As the ten-year increases, risk free assets become more attractive on a relative basis. Investors will sell RQI to buy treasuries until the spread adjusts to an appropriate level. That said, determining an appropriate spread is easier said than done.
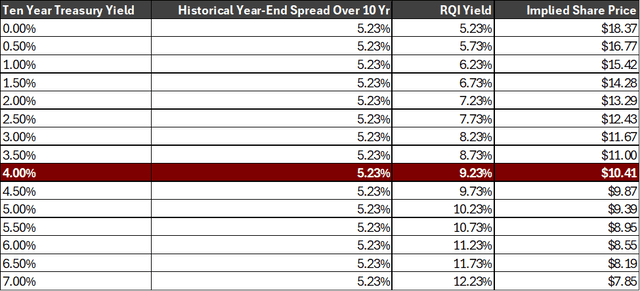
Comparing the year-end yield of the ten-year treasury against the year end distribution yield of RQI provides a point of comparison. Over the past ten years, RQI’s yield has been an average of 5.23% over the ten-year treasury at year end. The minimum spread was 2021 at 3.75% and the maximum spread was 2020 at 6.81%. If we assume 5.23% is the market spread for RQI over the ten-year treasury, we can establish a fair value matrix.
REITer’s Digest
Currently, the ten-year treasury rate is 4.09%. Accordingly, if we add our 5.23% spread to the current treasury rate, it implies a fair value price of $10.41 per share for RQI. Compared to RQI’s current share price of $11.75, the fund is overvalued on a relative risk basis. The current spread over the ten-year is 4.05%, nearing low end of the historical range. The price of shares needs to decline by 11.4% to regress to the average spread.
Data by YCharts
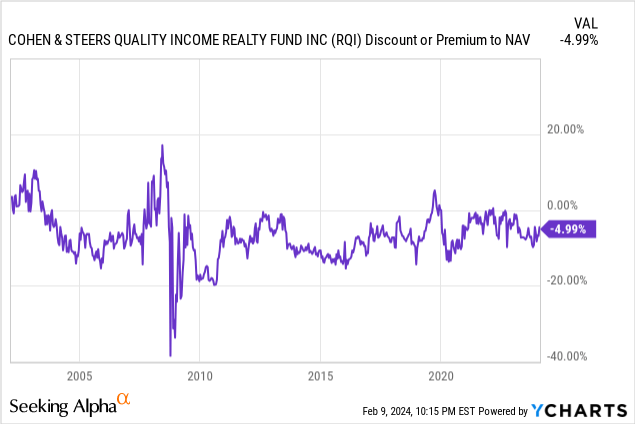
RQI is currently trading at a discount to net asset value of nearly 5%. As share prices trade independently of underlying assets, shares of RQI can be priced at a premium or discount to NAV. A discount to NAV could represent a buying opportunity for RQI. Opportunities where RQI trades at a discount to NAV and a yield premium to the ten-year treasury generally indicate the strongest buying opportunities for a fund like RQI.
Conclusion
Simply, RQI is one of our favorite closed-end funds. As disclosed, we hold long positions in the CEF, initially buying at deep discounts during the pandemic. The methodology above has provided a general guide for opportunities to add to the position. Over time, RQI has been able to outperform indexed competitors consistently. The management team is best in class, the portfolio is strong, and there are tailwinds that could continue to power REIT performance in 2024. While overvalued, RQI is in the “never sell” category given the consistent index outperformance. Let the tailwinds blow and be patient to strike when the iron is hot.